
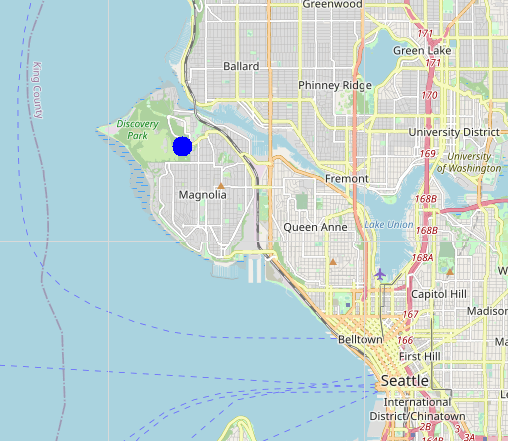
The image bellow was created using today’s script with OpenStreeMap. The blue dot marks the entrance to Discovery Park, Seatle.
You can adjust the size of the dot; I went with a radius of 10 for this example, just so the dot would be the focus of attention.

You can also download today’s code by clicking here.
Please feel free to uses this code in your own projects.
About OpenStreetMap
Today’s python script will be using a web-service called OpenStreetMap, which is 100% FREE to uses. However, it does cost money to maintain the servers, so the folks at OpenStreetMap would greatly appreciate any donations that you would like to make. Donations to this project can be made at https://donate.openstreetmap.org/.
You might want to take a few minutes to look over the OpenStreetMap Terms_of_Use and Acceptable_Use_Policy which both can be found at https://www.openstreetmap.org/about. Basically, this protects them and their data from any legal issues, and says that you are free to uses the data as you wish, just so long as you don’t abuses the servers ( like downloading the exact same data over, and over, and over again ).
The web-page https://wiki.openstreetmap.org/wiki/Slippy_map_tilenames gives a high-level overview of how to use the maps, showing code fragments in several programming languages. But it doesn't show any code examples that you could just cut/past into your own python projects. It’s meant to explain how the services works, and not to give any piratical examples. Hence, why I’m writing this article.
About the GEOData folder and ‘TILES’.
Today’s python script will be creating a folder on your hard-drive called GEOData. This folder is a holding area of many small picture files, which we will call tiles. A tile is a PNG picture file, which is 256 pixels wide by 256 pixels high. You can think of a tile like a puzzle piece, which are put together to create the maps on your screen.
The objective here is to NOT download any one tile more than once. By keeping the tiles in this folder, we achieve 3 very important things:
1. Greatly reduces the traffic on the OpenStreetMap servers because each tile needs to be download only once.
2. Greatly increases the speed of our python scripts because each tile needs to be download only once.
3. Allows us to access the maps saved on our laptop even if we are miles from the nearest WiFi hot-spot.
Here is today’s code to create the GEOData folder if it doesn't already exists.
try:
  GEODataFolder = os.path.expanduser( os.path.join("~", "GEOData") )
  if not os.path.exists( GEODataFolder ):
    os.mkdir( GEODataFolder )
except Exception as e:
  print( "Error: " + str(e) )
About ZOOM.
In today’s python script, the variable ‘zoom’ will hold an integer value from 0 to 19, and is used to define how ‘zoomed-in’ we are to the map. The value of 0 means that the entire world is shown in one title. The value of 19 means that we have zoomed-in so near to the map, that one tile holds about one house. For most applications, a value of 10 will give us a nicely usable street-level map of the city.
The deg2num() and num2deg() functions.
Two of the functions that I will be showing today, deg2num() and num2deg(), were copied from the OpenStreetMap web-page https://wiki.openstreetmap.org/wiki/Slippy_map_tilenames, which was mentioned above. Detail documentation about these functions can be found at that site.
Download a tile and show it on the screen.
It’s now time to download the first tile. This code fragment shows how to take a GPS location (longitude and latitude), and show a map tile on the screen for that general area of town.
Note that the tile is being saved into the GEOData folder that was created above. After it has been downloaded once, it will not have to be downloaded again to be re-used.
lat = 47.30682519444444
lon = -121.30463358333333
zoom = 10

(xtile, ytile) = deg2num(lat, lon, zoom )

url = "http://a.tile.openstreetmap.org/{}/{}/{}.png".format(zoom, xtile, ytile)
filename = "openstreetmap.{}.{}.{}.png".format(zoom, xtile, ytile)
filename = os.path.join( GEODataFolder, filename )
if not os.path.exists(filename): download(url, filename)
ImageMap = tk.PhotoImage(file=filename)
canvas.create_image(1,1,image=ImageMap, anchor=tk.NW)
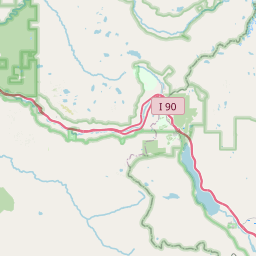
The results of the above code fragment:
Download and show a bigger map.
A single tile is only 256x256 pixels. That’s probably too small to be of any real uses.
To show a much bigger map, we download and display 9 tiles, putting them together like the pieces of a puzzle. The variables offsetX and offsetY are used to position the upper right corner of our map relative to the root window.
And here again, each tile is downloaded only once, and then re-used each time it’s needed.
Note how we are using a python dictionary object called Array to keep track of the 9 map images and canvases.
The GPS location (lat,lon) will be someplace within the center tile.
lat = 47.30682519444444
lon = -121.30463358333333
zoom = 10
( offsetX, offsetY ) = ( 30, 30 )

Array = {}

(xtile, ytile) = deg2num(lat, lon, zoom )
for x in range(0,3):
  for y in range(0,3):
    x1 = xtile + x -1
    y1 = ytile + y -1
    url = "http://a.tile.openstreetmap.org/{}/{}/{}.png".format(zoom, x1, y1)
    filename = "openstreetmap.{}.{}.{}.png".format(zoom, x1, y1)
    filename = os.path.join( GEODataFolder, filename )
    if not os.path.exists(filename): download(url, filename)
    z1 = "," + str(x) + "," + str(y)
    Array["ImageMap" + z1 ] = tk.PhotoImage(file=filename)
    Array["canvas" + z1 ] = tk.Canvas(root)
    Array["canvas" + z1 ].create_image(1,1,image=Array["ImageMap" + z1 ], anchor=tk.NW)
    Array["canvas" + z1 ].place( x = (x*256) + offsetX, y = (y*256) + offsetY )
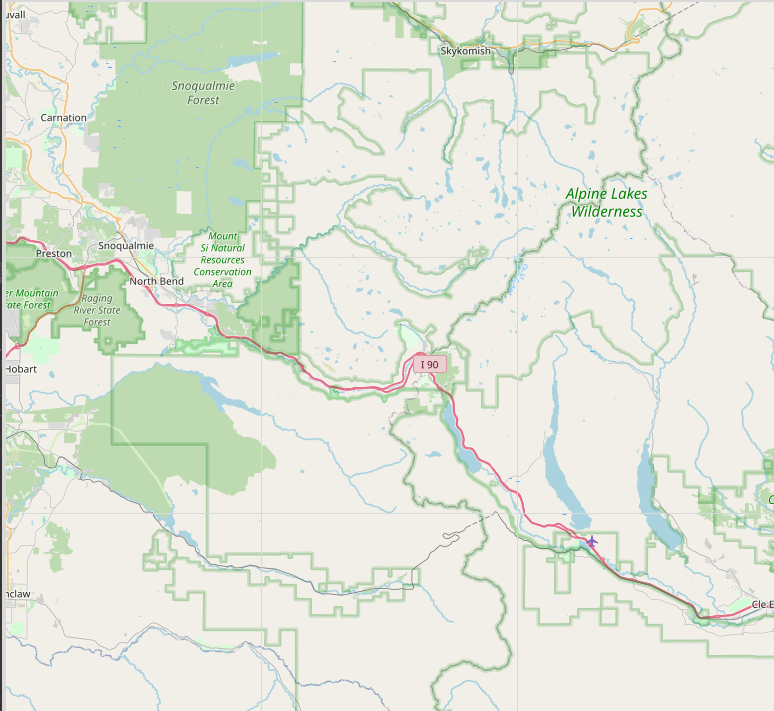
The results of the above code fragment:
Adding a blue dot.
Now the code fragment is going to get a bit more complected.
Let’s say that we want a blue dot on your map, marking the exact location given by (lat, lon).
Note that we are calculating the location of the blue dot for each of the 9 tiles, even though we know that the GPS location (lat,lon) will be someplace within the center tile. This is so that we don’t get just part of a dot. If we didn’t do the calculations for all 9 tiles, we might get only half a dot if the GPS location is near the tile’s edge.
lat = 47.30682519444444
lon = -121.30463358333333
zoom = 10
( offsetX, offsetY ) = ( 30, 30 )

Array = {}

(xtile, ytile) = deg2num(lat, lon, zoom )
for x in range(0,3):
  for y in range(0,3):
    x1 = xtile + x -1
    y1 = ytile + y -1
    url = "http://a.tile.openstreetmap.org/{}/{}/{}.png".format(zoom, x1, y1)
    filename = "openstreetmap.{}.{}.{}.png".format(zoom, x1, y1)
    filename = os.path.join( GEODataFolder, filename )
    if not os.path.exists(filename): download(url, filename)
    z1 = "," + str(x) + "," + str(y)
    Array["ImageMap" + z1 ] = tk.PhotoImage(file=filename)
    Array["canvas" + z1 ] = tk.Canvas(root)
    Array["canvas" + z1 ].create_image(1,1,image=Array["ImageMap" + z1 ], anchor=tk.NW)
    Array["canvas" + z1 ].place( x = (x*256) + offsetX, y = (y*256) + offsetY )

    # Calclulate the location of the blue dot.
    (dx,dy) = deg2posRef(x1, y1, lat, lon, zoom)
    rad=10
    Array["canvas" + z1].create_oval(dx-rad,dy-rad,dx+rad,dy+rad,width=0,fill='blue')

    Array["canvas" + z1 ].place( x = (x*256) + offsetX, y = (y*256) + offsetY )
Working from Postal Addresses.
So far, we have been working with maps based on GPS location (lat, lon). But what if we had a postal address instead?
Example: This is the postal address of Discovery Park in Seattle:
3801 Discovery Park Blvd, Seattle, WA 98199
Will, way back in March of 2019, I wrote an article titled “Python - Longitude, Latitude, and Address.”.
The link is http://gsw7.net/K700008.php.
In this article I described something called a geocoder, which is
“A function or utility that when given a postal address, will return the longitude and latitude of that address.”.
The geocoder() function that I am using is another service of OpenStreetMap.
So, I have copied that function from that old article, into today’s project. And since we can now transform a postal address into GPS concordances, we can display a map on the screen showing the exact location of this postal address.
Address = "3801 Discovery Park Blvd, Seattle, WA 98199"

venue1 = geocoder(Address)
for key,value in venue1.items():
    print( key + ": " + str(value) )
The result of the above code fragment:
address: 3801 Discovery Park Blvd, Seattle, WA 98199 version: 1.0 encoding: UTF-8 timestamp: Sun, attribution: Data querystring: 3801 exclude_place_ids: 43106929,43724717,124680638,63034961 place_id: 63034961 osm_type: node osm_id: 5388423116 place_rank: 30 boundingbox: 47.6576139,47.6577139,-122.4064343,-122.4063343 lat: 47.6576639 lon: -122.4063843 display_name: 3801, class: amenity type: toilets importance: 0.631>n3801 Discovery icon: https://nominatim.openstreetmap.org/images/mapicons/amenity_information.p.20.png>n Discovery
The complete code.
Here is the completed code for today’s project. It will create a map of of the north/west part of the greater Seattle area, with a blue dot marking the location of Discovery Park. This map is the one that I placed at the top of this document.
"""
maps4.py
written by Joe Roten, 10/18/2020

This script is an example of added a street map
to your project.

For documentation:
  http://gsw7.net/K700016.php

"""

import requests
import urllib.request
import tkinter as tk
import math, os


def download(url,filename):
    """Download a file."""
    try:
      objFile = requests.get(url, allow_redirects=True)
      open(filename, 'wb').write(objFile.content)
    except:
      pass

def deg2num(lat_deg, lon_deg, zoom):
    """Compute the OpenStreetMap.org tile numbers."""
    # This is from: https://wiki.openstreetmap.org/wiki/Slippy_map_tilenames
    lat_rad = math.radians(lat_deg)
    n = 2.0 ** zoom
    xtile = int((lon_deg + 180.0) / 360.0 * n)
    ytile = int((1.0 - math.asinh(math.tan(lat_rad)) / math.pi) / 2.0 * n)
    return (xtile, ytile)

def num2deg(xtile, ytile, zoom):
    """This function is the reverse of deg2num."""
    # This is from: https://wiki.openstreetmap.org/wiki/Slippy_map_tilenames
    n = 2.0 ** zoom
    lon_deg = xtile / n * 360.0 - 180.0
    lat_rad = math.atan(math.sinh(math.pi * (1 - 2 * ytile / n)))
    lat_deg = math.degrees(lat_rad)
    return (lat_deg, lon_deg)

def deg2posRef(xtile, ytile, lat_deg, lon_deg, zoom):
    """Retrun the position on the tile (in pixles) of lat_deg, lon_deg,"""
    (ry1,rx1) = num2deg(xtile, ytile, zoom)
    (d,rx2) = num2deg(xtile+1, ytile, zoom)
    (ry2,d) = num2deg(xtile, ytile+1, zoom)
    dx = (rx1-lon) / (rx1-rx2) * 256
    dy = (ry1-lat) / (ry1-ry2) * 256
    return(dx,dy)

def geocoder(address):
    """This function will return a dict object, containing geocoder info for the postal address given."""
    data = {}
    data['address'] = address
    url = "https://nominatim.openstreetmap.org/search/%1%?format=xml&polygon=1&addressdetails=1"
    url = url.replace("%1%", address).replace(" ", "%20")
    headers = {'User-Agent':"Mozilla/5.0 (X11; Ubuntu; Linux i686; rv:48.0) Gecko/20100101 Firefox/48.0"}
    req = urllib.request.Request(url, headers = headers)
    html = urllib.request.urlopen(req).read()
    str1 = str(html).replace("\\", "").replace("'", "").replace('"', "")
    list1 = str1.split(' ')
    for items in list1:
        parts = items.split("=")
        if len(parts) == 2:
            data[parts[0]] = parts[1]
    return data


if __name__ == "__main__":

  root = tk.Tk()
  canvas = tk.Canvas(root)
  canvas.pack()


  Address = "3801 Discovery Park Blvd, Seattle, WA 98199"
  zoom = 12
  ( offsetX, offsetY ) = ( 30, 30 )


  venue1 = geocoder(Address)
  lat = float(venue1.get("lat"))
  lon = float(venue1.get("lon"))


  # Create the GEOData folder if it does not exists.

  try:
    GEODataFolder = os.path.expanduser( os.path.join("~", "GEOData") )
    if not os.path.exists( GEODataFolder ):
      os.mkdir( GEODataFolder )
  except Exception as e:
    print( "Error: " + str(e) )


  # Show the map on the screen.

  Array = {}

  (xtile, ytile) = deg2num(lat, lon, zoom )
  for x in range(0,3):
    for y in range(0,3):
      x1 = xtile + x -1
      y1 = ytile + y -1
      url = "http://a.tile.openstreetmap.org/{}/{}/{}.png".format(zoom, x1, y1)
      filename = "openstreetmap.{}.{}.{}.png".format(zoom, x1, y1)
      filename = os.path.join( GEODataFolder, filename )
      if not os.path.exists(filename): download(url, filename)
      z1 = "," + str(x) + "," + str(y)
      Array["ImageMap" + z1 ] = tk.PhotoImage(file=filename)
      Array["canvas" + z1 ] = tk.Canvas(root)
      Array["canvas" + z1 ].create_image(1,1,image=Array["ImageMap" + z1 ], anchor=tk.NW)
      Array["canvas" + z1 ].place( x = (x*256) + offsetX, y = (y*256) + offsetY )

      # Calclulate the location of the blue dot.
      (dx,dy) = deg2posRef(x1, y1, lat, lon, zoom)
      rad=10
      Array["canvas" + z1].create_oval(dx-rad,dy-rad,dx+rad,dy+rad,width=0,fill='blue')

      Array["canvas" + z1 ].place( x = (x*256) + offsetX, y = (y*256) + offsetY )


  root.mainloop()

# End of maps4.py
In concussion.
And that concludes what I have to say about adding maps to your python projects. I hope that someone out there find’s this useful.
Everyone have a good day, and be kind to each other.
Joe Roten. www.gsw7.net/joe
Last updated: 2020-10-19

As always
The information on my website is FREE.But donations to help pay for Coffee and Beer are always welcomed.
Thanks.